Introduction
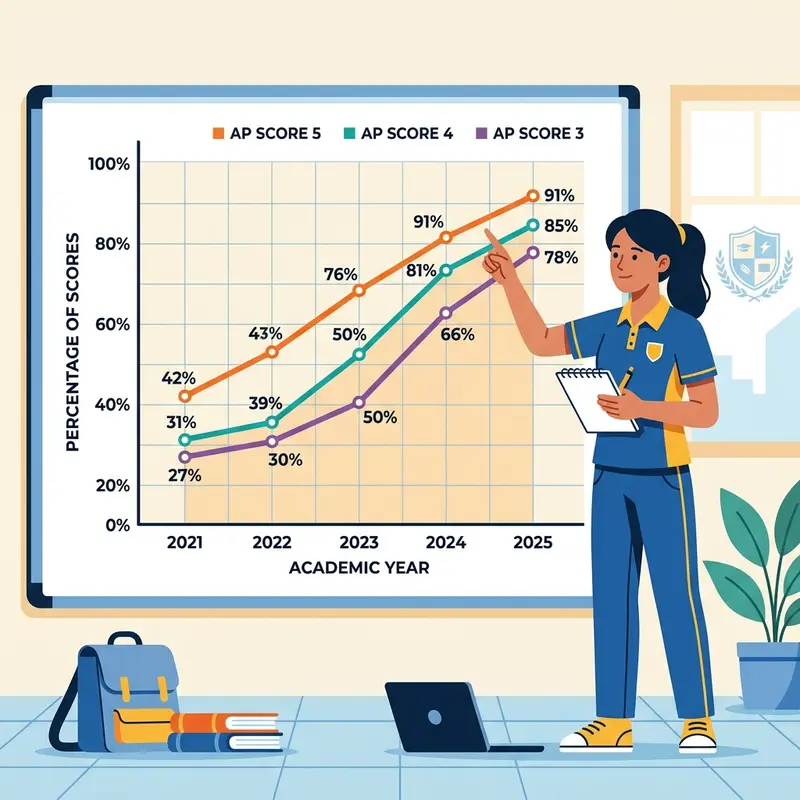
Every year, millions of high school students sit for Advanced Placement (AP) exams, hoping to earn college credit or showcase their academic rigor to university admissions offices. However, many students do not understand how their raw test scores are converted into the final 1-to-5 score. Scoring curves are not static; they change annually based on student performance, questions' relative difficulty, and changes to the course rubrics.
In this comprehensive analysis, we examine historical AP score distribution data from 2020 through 2025 across several major AP courses, including AP US History, AP Calculus AB/BC, AP US Government, and AP Biology. We will explore how passing rates have shifted, explain the mechanics of the College Board's psychometric scaling, and discuss what these trends mean for students preparing for future tests.
1. How the College Board Calibrates AP Score Curves
Contrary to popular belief, AP exams are not curved in a way that limits the number of students who can earn a 5. There is no quota. If every student demonstrates a level of mastery equivalent to an "A" in a college-level course, every student can theoretically receive a 5.
To achieve this consistency across different years, the College Board uses a process called **equating**. Psychometricians insert "anchor questions" (questions from previous exams) into new tests. By comparing how the current cohort performs on these anchor questions compared to previous cohorts, the College Board adjusts the raw score thresholds (cutoffs) for each score point. This ensures that a score of 4 in 2025 represents the exact same level of knowledge and skill as a 4 in 2020.
"Equating is essential because it guarantees fairness. A student taking a slightly harder version of the test in May will not be penalized relative to a student who took an easier test the year before." - Educational Testing Services (ETS) Psychometric Guidelines
2. Five-Year Score Distributions: Key AP Subjects
To illustrate how these thresholds and passing rates have changed, let's examine the percentage of students earning each score in representative AP courses between 2020 and 2024 (with early release figures for 2025).
AP US History (APUSH) score shifts
APUSH is notorious for its strict grading rubric, particularly on the Document-Based Question (DBQ) and Long Essay Question (LEQ). However, in recent years, the distribution of scores has shown an interesting rebound.
| Year | Score 5 | Score 4 | Score 3 | Score 2 | Score 1 | Pass Rate (3+) |
|---|---|---|---|---|---|---|
| 2024 | 10.3% | 20.8% | 26.2% | 24.3% | 18.4% | 57.3% |
| 2023 | 10.6% | 21.0% | 26.4% | 23.3% | 18.7% | 58.0% |
| 2022 | 10.7% | 21.6% | 25.8% | 23.0% | 18.9% | 58.1% |
| 2021 | 7.2% | 16.8% | 23.2% | 27.5% | 25.3% | 47.2% |
In 2021, the pass rate plummeted to 47.2%, largely due to disruptions from virtual learning and shortened online testing formats. As classrooms stabilized, pass rates rose back to near the historical average of 57-58%.
AP Biology score trends
AP Biology went through a major overhaul in 2020, reducing the emphasis on raw memorization and eliminating the mathematical grid-in questions in favor of integration inside the MCQ section. This shift created stable, positive trends:
| Year | Score 5 | Score 4 | Score 3 | Score 2 | Score 1 | Pass Rate (3+) |
|---|---|---|---|---|---|---|
| 2024 | 12.1% | 23.8% | 29.2% | 23.5% | 11.4% | 65.1% |
| 2023 | 14.3% | 23.1% | 27.8% | 23.6% | 11.2% | 65.2% |
| 2022 | 15.0% | 22.4% | 29.1% | 23.4% | 10.1% | 66.5% |
3. The Impact of Rubric Revisions (e.g., 2024-2026 Relaxations)
Historically, major rubric revisions cause a temporary drop in student performance followed by recovery as educators adjust their teaching materials.
However, the recent **2024-2026 rubric updates** for AP History exams (US History, European History, and World History) have actually decreased the difficulty of earning certain evidence points. Specifically, the College Board lowered the requirement for DBQ document sourcing and usage:
- Evidence point (1 point): Students now only need to successfully describe the content of at least **3 documents** and support an argument using at least **4 documents** (previously 6).
- Sourcing point (1 point): Students only need to explain the historical context, audience, purpose, or point of view (HIPP) for at least **2 documents** (previously 3).
This relaxation explains why the percentage of students earning a 3 or higher has stabilized and even risen in the 2024 and 2025 exam cohorts. It has made the DBQ section slightly more forgiving, allowing students to earn vital rubric points even with minor document omissions.
4. Why Some Subjects Have Unusually High Pass Rates
A common point of confusion is why courses like **AP Calculus BC** have pass rates exceeding 80%, while **AP US Government** pass rates sit near 50%.
This is not because Calculus BC is an easy exam. Rather, it is a result of **self-selection**. The student cohort that registers for Calculus BC has already completed advanced pre-calculus or Calculus AB, representing a highly motivated, mathematically advanced subset of students. In contrast, AP US Government is often a graduation requirement taken by a wider range of students, resulting in a broader distribution of scores and a lower average pass rate.
5. How to Utilize Historical Curves to Plan Your Preparation
Understanding historical curves allows you to approach your practice exams strategically:
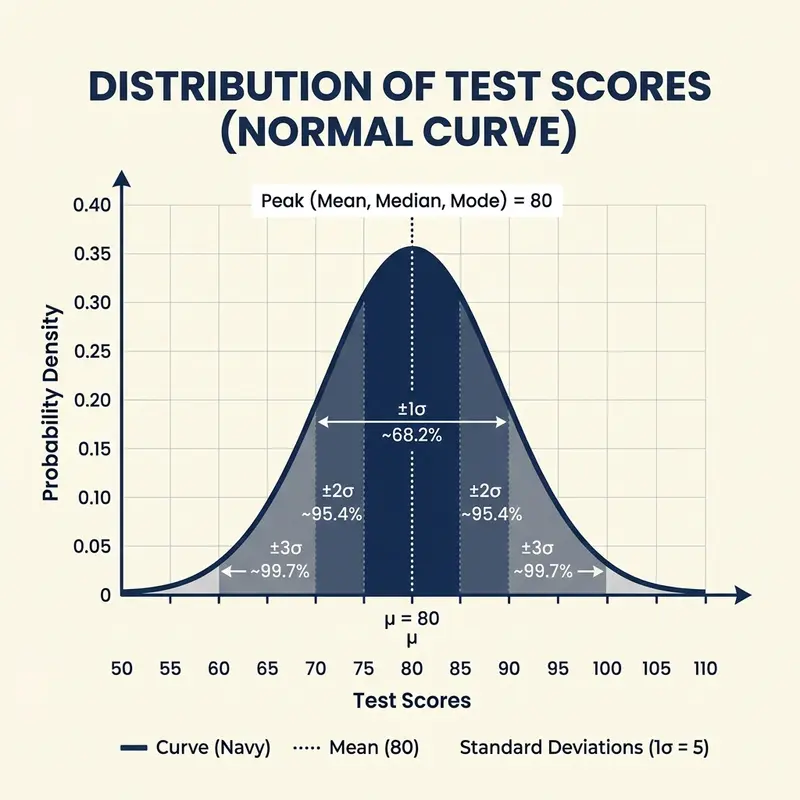
- Establish a Safe Target: Since a 5 usually requires an accuracy rate of 74% to 80% depending on the exam, you do not need a perfect score. You can make mistakes and still earn the highest credit.
- Optimize Section Weightings: If you are struggling with free-response writing, remember that scoring 85%+ on multiple-choice questions takes the pressure off the written essays. Use our scoring tools to experiment with different raw scoring scenarios.
- Learn from Practice Rubrics: When practicing with past FRQs, look at the historical student sample essays provided on AP Central. Analyze why a sample essay earned a 4 vs. a 6 to calibrate your own writing.
Conclusion
By monitoring historical trends and understanding how the College Board converts raw performance to scale scores, you can study more effectively. Focus on consistent practice, familiarize yourself with task verbs, and use our tools to verify your target score goals.
- College Board AP Exam Data and Student Score Distributions (2020-2024)
- College Board Program Summaries and National Reports (Annual Archives).
- Educational Testing Service (ETS) Technical Manuals on Score Equating Procedures.